Introduction
Demonstration calculations have been performed with PHOENICS 3.2 for a case specified by Fiat Research in an email to Peter Spalding, dated 3/11/99.
The geometry of a split pipe was supplied as a CAD file in STL format, and imported directly into the PHOENICS-VR environment. The PHOENICS representation is shown in below.
CAD imported in STL format
In the case shown, air enters a single inlet at the base of the diagram shown above, and one might expect it to separate at the division of the pipe internally, to exit via two outlets at the top. A Cartesian grid of 50*50*10 cel s was used to represent the geometry. The case took under 2 hours to set up.
Geometrical details, Boundary Conditions and Fluid Properties
For convenience purposes, the imported CAD geometry was rotated around the X-axis by 12° to align with its bounding box. The outside temperature was 20°C and the pressure ambient. Turbulent ai at 60°C enters the inlet at 50 m/s.
Calculation Time
The calculation took roughly 2 hours to run on a PII/266 computer. The case took 300 sweeps before reaching satisfactory convergence.
Results
Graphical results showing velocity, stream lines, temperature and pressure were requested by the client. All pictures shown are generated within the PHOENICS VR-Viewer.
Velocity vectors
Immediate observation shows that the bulk of the flow exits through one outlet. Close observation indicates in-flow through the second outlet.
Velocity vectors coloured by velocity
Scrutiny of the velocity vectors readily demonstrates the flow and shows regions of re-circulation and, again, inflow through an outlet.
Velocity vectors coloured by temperature
Streamlines coloured by pressure
Re-circulation is most easily identified via streamlines selected at inlet and outlets.
Contour plot of temperature
Contour plot of temperature (different slice through Y)
Contour plot of pressure
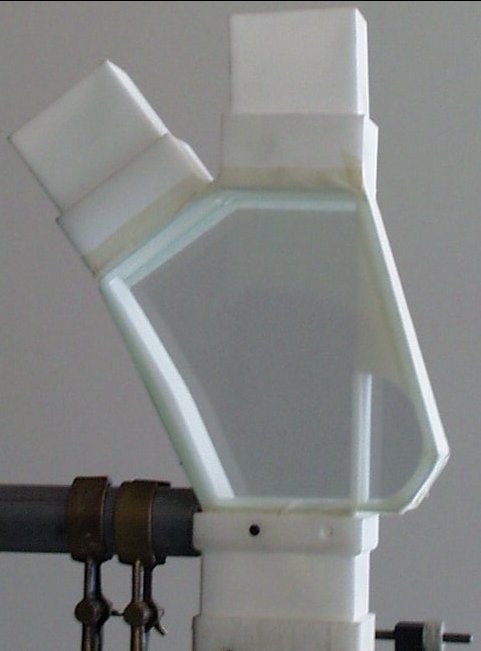
Supplementary information
Following receipt of the results from CHAM’s demonstration, Fiat Research built a prototype split-pipe physical model and took photographs of the process through a transparent wall in the pipe. The geometry an the experimental results are shown below.